

Using Graphics in Forensic Reports
Apr 04, 2023A picture is worth a thousand words.
We've all heard the adage. And you can read more in this post about the studies that back it up. Our field prides itself in following the science of human cognition and behavior. And virtually all of it tells us that we're visual creatures - we learn and respond more favorably to visual imagery than written words alone. So why don't we default to more graphics in our psychological reports?
It's a lack of knowledge - we're not sure how. And a lack of modeling from our colleagues, who also don't know how.
In this post, we'll try to tackle both!
How can we use graphics in forensic reports?
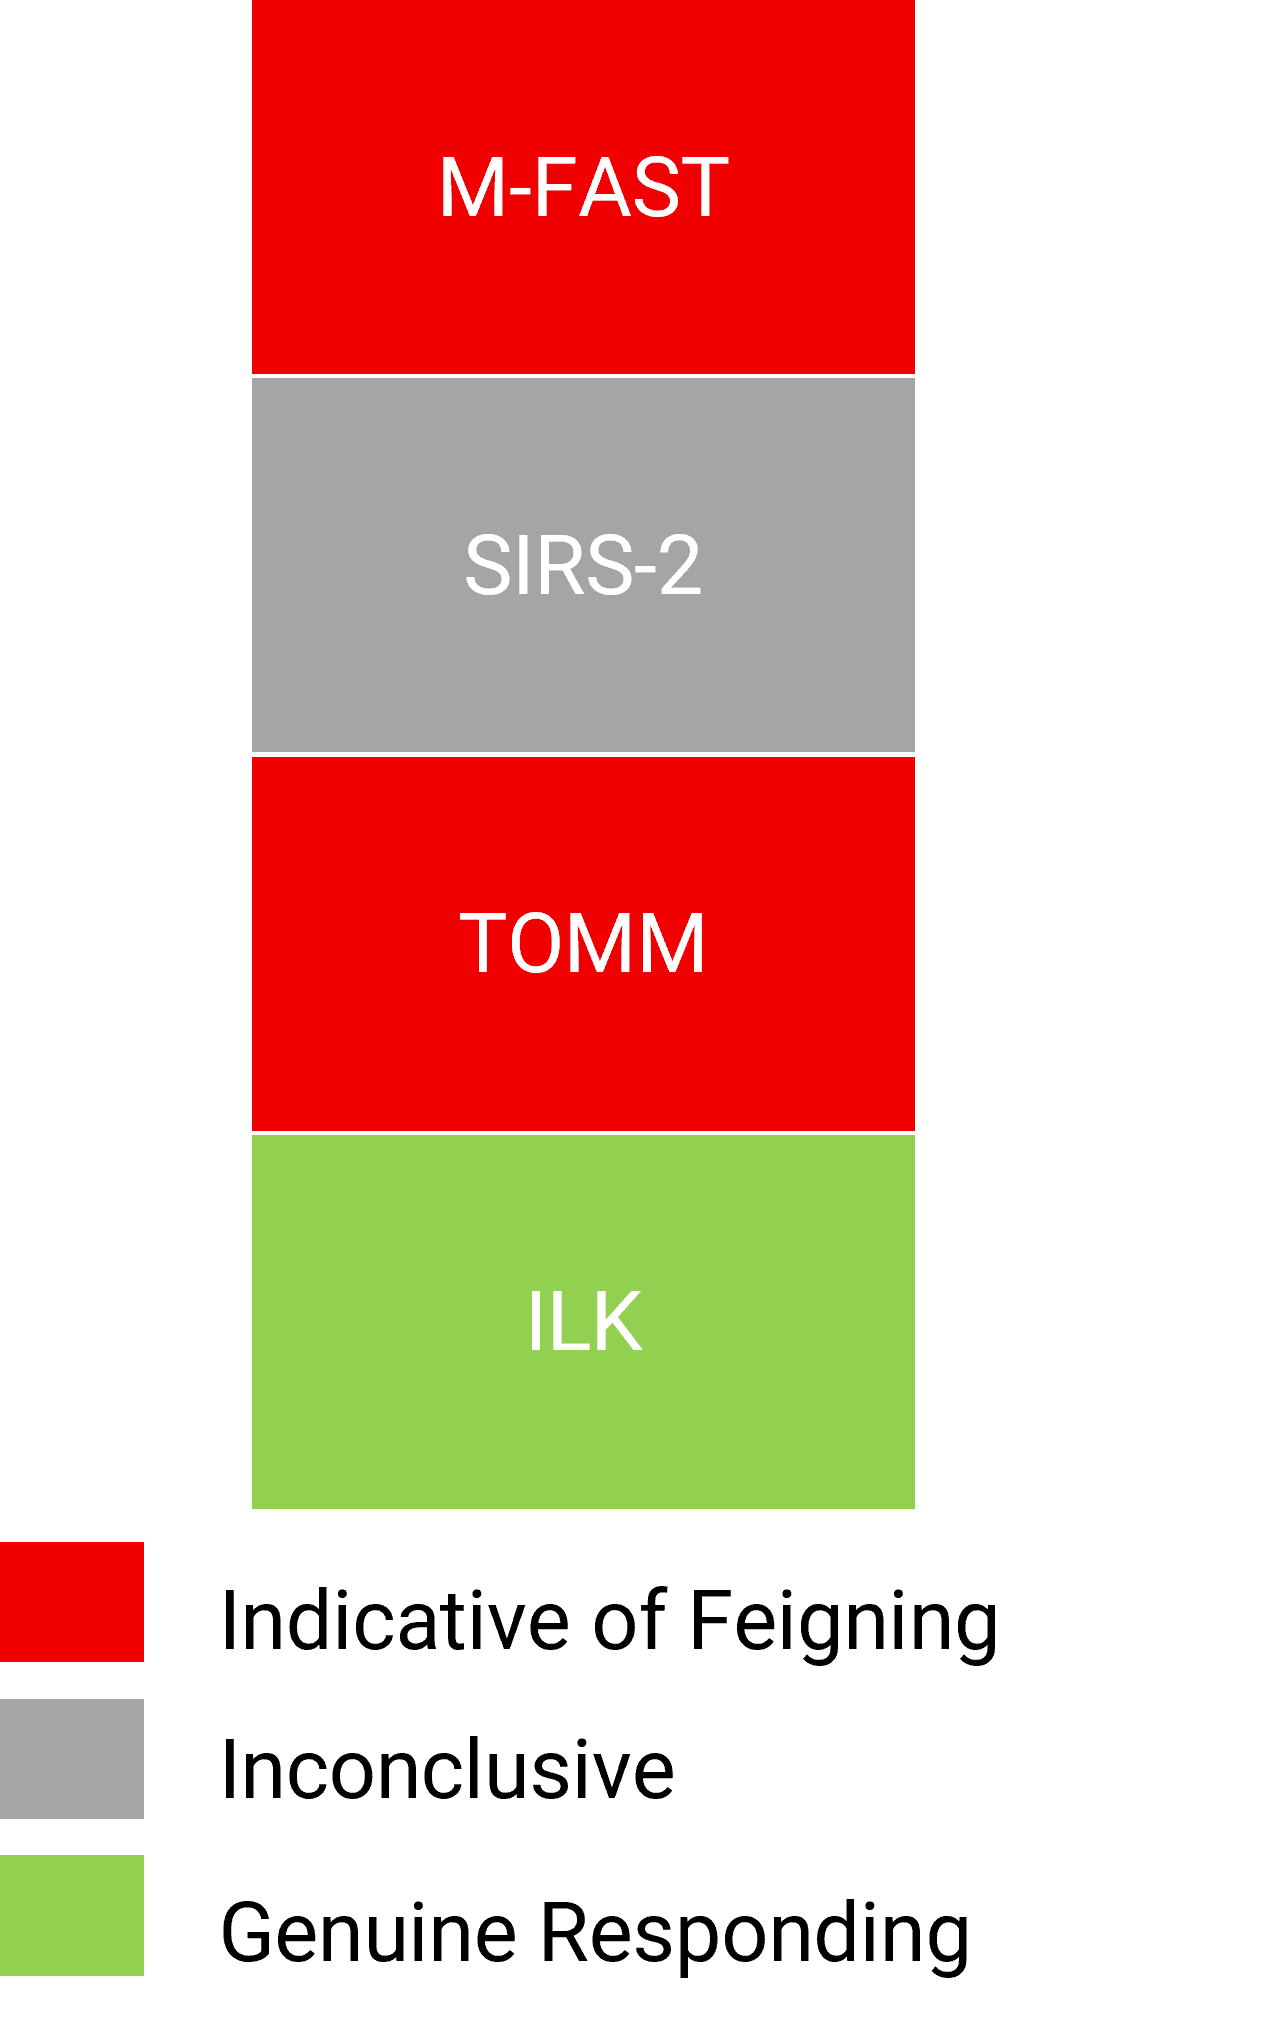
1. To convey data
This is what most folks are most comfortable with because it's typically how we use tables (see below for a discussion of the difference between tables and graphics). It is literally taking an important score or testing outcome, and placing it into a graphic to highlight its meaning. Like this:

2. To convey relationships
This would involve more of a contrast/comparison type of relationship. It could work for something like a test-retest discrepancy, or two very discrepant test scores within the current battery.
3. To convey magnitude
This could be used to convey the strength of a specific finding. For example, a significantly below-chance score, or a score that falls so far above or below a given cut score that the distance between that cut and the obtained score is meaningful towards conclusions.
4. To convey opinions
This would be something that represents the core inferences or conclusions reached in the report. For example, if you created a graphic to represent an ultimate opinion or level of confidence in a malingering classification. These are probably the most powerful but also the most ripe for misrepresentation, so use judiciously.
How do we make them?
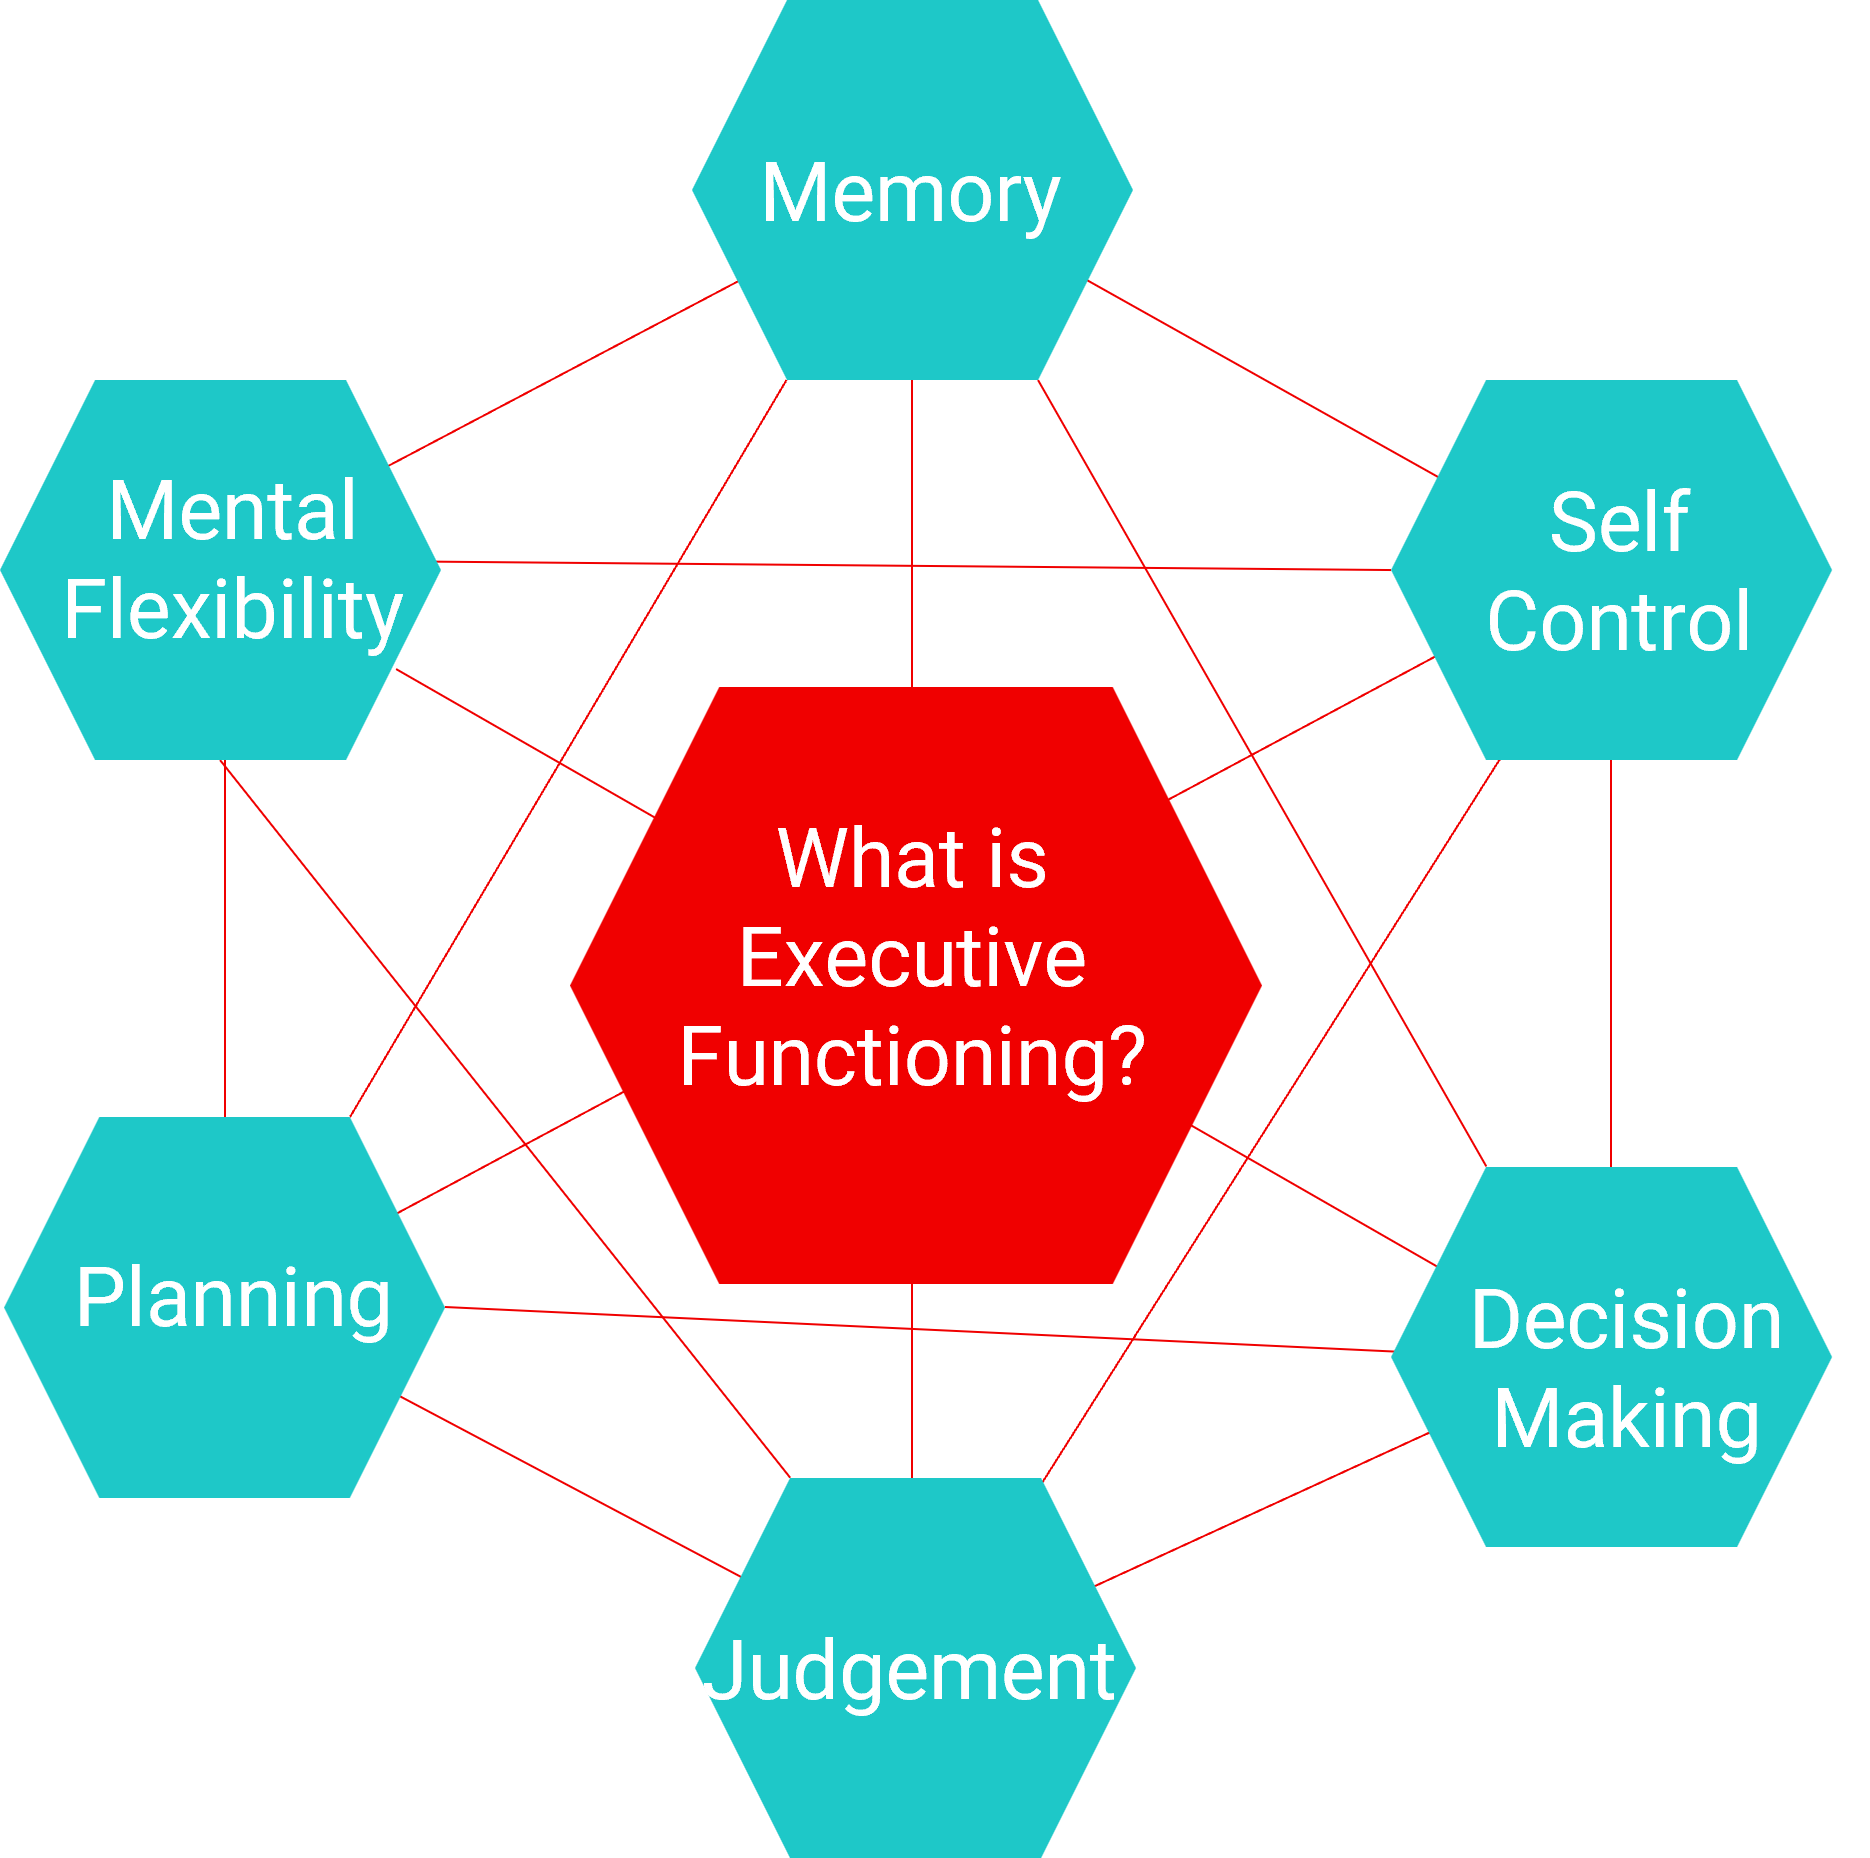
1. Custom
This involves building your graphics from the ground up. So for example, using simple shapes, colors, and text you can take a wealth of data and try to communicate meaning through one picture, like this:
Also remember that something like this would never exist on an island. Somewhere in your narrative you're also explaining the tests, and outlining the data foundational to the graphic.
To make graphics like this, you can use the Microsoft suite (utilizing and combining shapes, colors, images, icons, or tables in PowerPoint, Word, or Excel), the Adobe suite (Illustrator, Photoshop), and Canva with relatively equal effectiveness. This was also made quickly and easily with some of these tools:

So, the format you choose is more dependent on your skill set, budget, and personal preferences. But ultimately the point here is that you'll need to lean on some moderate computer skills, but then what you create is limited only by your imagination...
2. Pre-made
These are most typically graphics packages that work with PowerPoint where you pay for the package, download the set of files, and then open up the graphics inside PowerPoint to edit or manipulate with your data. Two of the more common I'm familiar with are infograpia and simple slides, but there are loads of others. Some of the benefits of these are that you get a really professional look, and it's typically easy to change colors with just a few easy changes to make them look custom. At the same time, the files can be somewhat hard to browse so sometimes it's not always easy to find what you're looking for, and you're more limited in changing things if they're not a perfect match for your needs.
3. Hybrid
These are pre-constructed templates with more flexibility - their intention is to be used as they are with simple changes to color or depth, but not heavy modifications. Some examples of this are smart art from the Microsoft suite, or Canva templates where you can drag-and-drop your own info, change the colors, and export the picture right into your report. So for example, in this image the functional capacities of no concern are represented in green, the possible concerns in yellow, and the major domain of impairment shown in red:
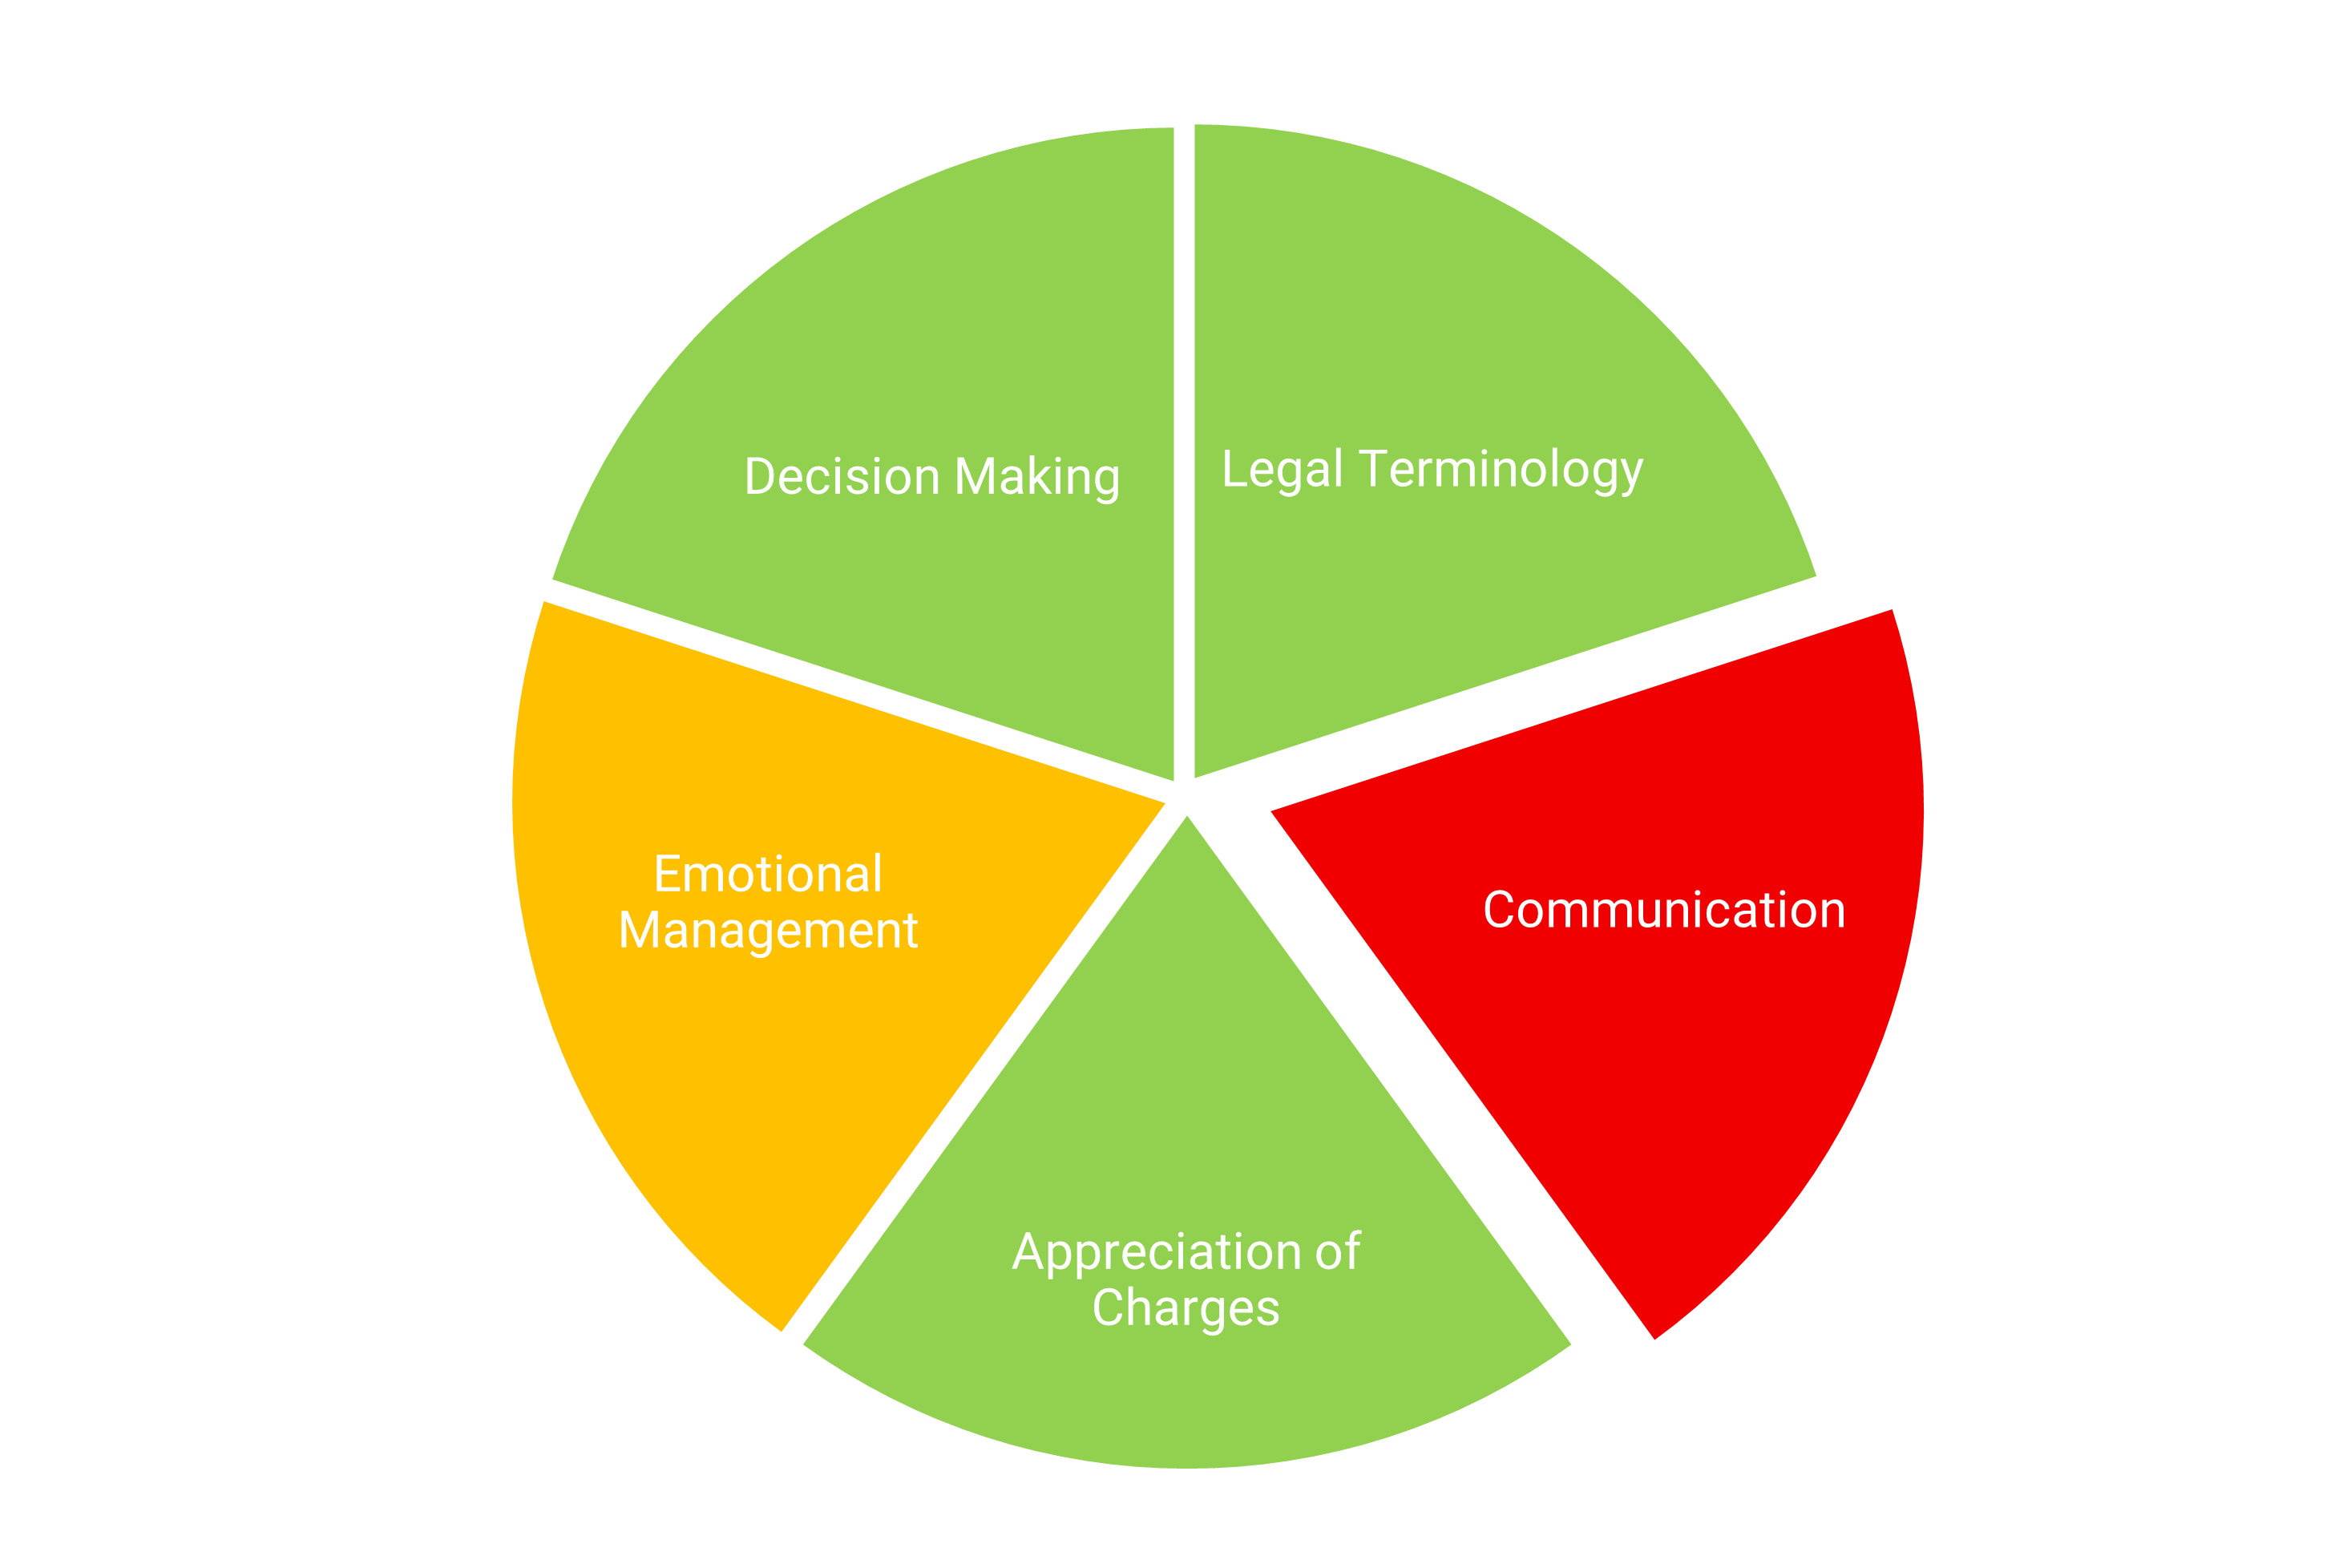
The benefits to these are ease, and the relative lack of technical knowledge necessary, as well as that they tend to be a little more flexible than a drag-and-drop graphic like you get with a pre-made. But the downsides are that they still tend to limit flexibility, and you can't always find a great translation for your specific need.
What else should we know about using graphics in psychological reports?
1. Less is more.
This is about the number of visuals used throughout the report. And even in clinical assessment which tend to be testing-heavy, I would still argue that fewer is better than many. I would not use one for every test, for example. I'd consider using one or two from just your most important testing outcomes. Or even better, consider what are the 1-3 most important collective concepts or themes that come from all the testing used, and make that into a graphic.
2. Simple is better.
The entire point of making data visual is to make it understandable. If we simply take a dense, cluttered narrative and make it a dense, cluttered picture, then we've probably made things worse, not better. So it should be something that can be seen and understood in 3-5 seconds. Any longer than that, and we're likely to lose our reader.
3. Location, location, location.
This is about the question of imbedding graphics within the report narrative, or at the back in appendices. And the answer is going to depend a ton on the referral question or the forensic question. Not only that, but the data itself will drive where it goes in the report as well. So here's the rule of thumb I try and use. If it's just conveying scaled scores - a listing of all the data for the sake of transparency - I call that a table. If it's about translating or representing an idea, that's a graphic. We'll break these down one at a time.
Tables. The visuals of these are still important, but the entire purpose of them is different. I would argue that a table should usually be in an appendices unless it is the core basis for your answer to the main referral question. A good example of this might be the HCR-20 on a risk assessment. Even so, I recommend keeping the reader in mind and breaking the table up for the easiest and most graphic-forward presentation when doing this. So sticking with the HCR example, having three tables, one for each domain, and adding color or contrast but also organizing the table so that it can be digested as quickly and clearly as possible.
Graphics. These are visual representations of data that are not about precision, they're about translation. The primary goal of a good graphic is to take complicated psychological concepts and make them rapidly and clearly understandable for the target reader. This means that they tend to be in high-impact places in the report narrative to help drive home a core concept.
If you want to learn more about the structure and presentation of empirically-based report writing practices, consider our flagship course on Consumer Driven Forensic Report Writing.
Here at Streamline, we're committed to using our powers of psychology for good. Starting from the science and empirical literature but arriving at the core of what matters. Focusing on what readers and consumers truly want. Keeping sight of what clinicians need. In our blog, videos, and courses, we’re here to serve clinical and forensic assessment psychologists, especially those early-to-mid-career with an eye toward improvement, innovation, and inspiration.
Stay connected with news and updates!
Join our mailing list to receive the latest news and updates from our team.
Don't worry, your information will not be shared.
No spam, no sharing, unsubscribe anytime.
